
Introduction
The main influential factors on student attitude towards school and his readiness to learn, are his friends of the same age, even more than his parents (Wilkinson & Kraljevic, 2004; Sherman et al., 2002). Are we correctly understood what is really going on inside those youth groups in schools?
Lack of friends is a warning sign for a young boy, who could endanger himself and others. Finding these children on time, and empowering them, can reduce the danger and improve their study achievements (Wilkinson & Kraljevic, 2004; Sherman et al., 2002). How successful are we in identifying them on time?
The integration of 'special education' children in 'regular' classes is a major challenge. It has an immense importance on integrating them fully as equal and productive members of society. Do we know how to measure the integration of each one of them?
Complex systems - like a group of children and teachers - are inherently elusive and difficult to understand fully. Network simplifies complexity and makes it visual. In recent years there have been developments in theory and practice, enabling to consolidate networks based measurement tools for various issues in the social sciences, which has significant implications, also for education. This article will focus on that.
We define "network" as a set of interconnected elements / nodes. Through those interconnectivities (linkes), material, energy and information can be transferred. Networks are an effective visual expression of complex systems: organizations, schools, kindergartens, etc. (see chart below):
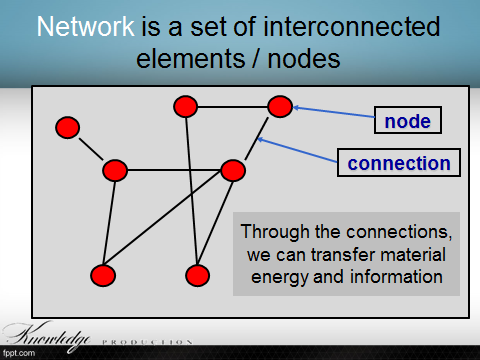
The way that linkes are being deployed throughout the network, is the basis for understanding the complex system. Different deployment of links between the nodes will create two distinct systems, with contradictory characters!
The tool that uses network for analyzing and understanding various types of organizations is called "organizational network analysis - ONA". The use of this tool is nothing less than a revolution, that will intensify over the next decade! It changes the management world, and our understanding of organizations, and the patterns that control them. It gives us a fast and accurate detection of social skills and highlights the roots of the problems - rather than the symptoms - in classrooms. for example, we can easily detect the:
- Social acceptance and leadership team: dominant students (for example, the class' king and queen) in the eyes of their peers ;
- Social rejection: cut off (disconnected) children who are isolated, boycotted and an object of harassment by the Group;
- Communication in the Group: the distribution to subgroups (cliques) and the "bottlenecks" between them (the connectors between cliques).
- Students who fulfill other social functions: "the nerd of the class", "the class bully", and the like;
- Students who can be mentors of weaker students.
- Partnerships: children who can work together;
- Classroom, grade level and school climate.
- School culture.
- Social climate of groups in school.
- Classroom social cohesion as a measure of comparison.
- Well-being of each student;
- The most grade level's powerful class;
- The relationship between social connections and educational achievements;
- The level of cooperation within the group and between groups, and the distribution of children according to this criterion;
- Degree of success in treating a cut off children, combined with special-needs children and children from disadvantaged groups; and correction of deficiencies;
- Connection between all these, and the learning and achievements of the group.
networking revolution in Management
In recent years, computer skills - that describe Networks graphically (see below), to reflect organizational structures and processes - were very much improved. Measurement opens up possibilities for extracting effective management tools using metrics, and even presentation of complex issues and fine distinctions, like the difference between 'cooperation' and coordination. Furthermore. computers have been evolved, and their abilities allow the operation of varied measurement systems for networks (Razy and Yehezkeally, 2012; Aalst and Song, 2004).
In recent years, Networking Revolution received a big boost in organizational diagnosis, and expanded into areas such as education and competitive sports. 18 case-studies conducted in the last two years in different classes - from kindergarten to the end of high school - provide significant insights about the implications for the use of this tool by the staff in educational institutions. The results indicate no less than a revolution!
"Networking revolution in management" consists of three networking features, that are relevant to us: network reflects the system's characteristics; Visualization; Measurement and comparison:
- Network reflects the system's characteristics: if I can "translate" the organization to a network, it will reflect the organization's condition, such as X-rays shows the state of a photographed body! Many companies offer network diagnostics (there are also free products for use, that they require skills). Those companies differ on the ways they "translate" systems to networks, and also, in the interpretation of the findings. Analysis can be done by eyes (decoding network) or by using algorithms (measurement), and be displayed using graphs, tables and "control clocks":
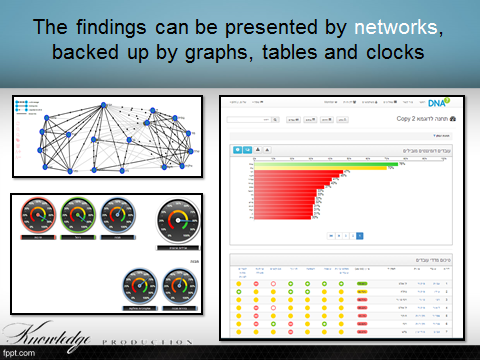
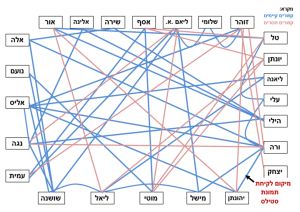
- Visualization: Visual display is simple; Easy to understand; And provides more insights from the "dry" data. The article's opening image (top of page) is a good example: This is an illustration of a 24 kindergarten children. Blue wire reflects friendships; Red show missing / desired connections. All this information is presented in a single picture! The network reflects the whole organization image. There is no need for the manager to know how to "read" a network. The analysis is done using algorithms, and the results are displayed using clocks, tables and graphs. Visualization allows us to see management in our eyes, and not just talk about it. In my experience, a network picture of an organizational problem is the best way to motivated a manager to act!
- Measurement and comparison: Using graph theory - which is a branch of mathematics - we can measure "soft" elements that were not measured, until now, giving them a numeric score and compare them, within and outside the organization (Benchmark of children): power, influence, cooperation, leadership, "intermediaries" between cliques and the like. Numeric indices are comparable, and allow to examine the intervention in the group, by measurement before and after.
Network Analysis Components
- The main factor that drives systems and can be diagnosed by networks, is "Power": the ability to force others to do your will, even if it is against their interest at the time.
- "Influence" in the network is operating Informal power (like the influence, a dominant teacher has on his students, over the years.
- "Colaboration": powerful children in the group cooperate with their supporters on one hand; But tend not to with other powerful children on the other hand, in order not to empower them.
- Socially isolated children will be identified by the lack of interaction (links) with the group.
Fear from power is the complement's concept to "Power". Powerful children who do not tend to cooperate usually, may join forces against an opponent.
An experienced team should know how to diagnose the children, as individuals and as a group. However, the case-studies indicate that they have difficulty in correctly diagnosing the powerful children. What is more important, in my opinion, is the fact that they also fail to diagnose the disconnected children. It happenes because of the manipulation of powerful children. For example, we found a 'class queen' who was hiding behind an impostor. This phenomenon of mistaken diagnosis is not unique to education. In many cases, organizations managers were constantly surprised from network diagnostic findings.
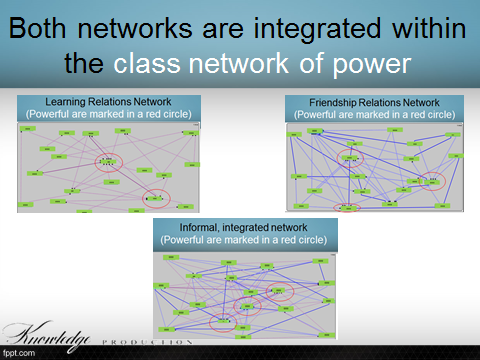
From what a class network is made of?
The network is made of two sub-networks: a friendships network and a learning connections network. Both networks are integrated to one, that shows the class network of power:
What is the process of a Network Diagnosing?
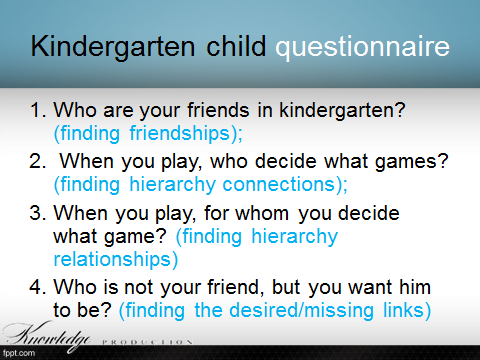
- The children were asked to fill out a short questionnaire about their relationships in the classroom: hierarchy, friendships and desired connections.
- A Report is obtained from the answers, concerning the formulating of the class / school (centralization / decentralization); Power and influence; Significant and strength of the connections (simulated power; popularity).
- Identifying strengths and weaknesses in the social structure;
- Macro insights: school analysis as a whole.
- Micro insights: classes and students analysis.The ideal situation is repeating the questionnaire periodically, comparing processes and testing interventions, over time.
Questionnaire
The role of the questionnaire is to identify the location of the child in the network. Here is a sample of a kindergarten questionnaire (in this case, the teacher asks the questions and feeds them to a computer).
 Illustration of the computerized report
(This is the report from the same kindergarten that was pictured in the opening of the article)
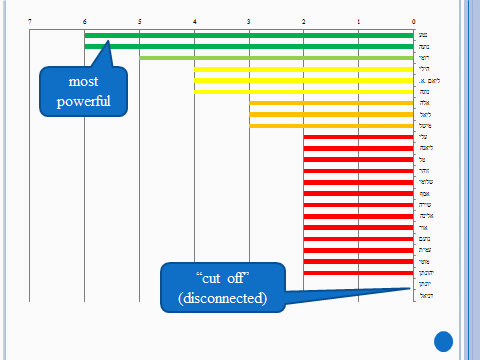
- Three children hold most of the power among the children (see chart below, which is a benchmark of the division of power, from the most powerful child to the disconnected children. We can see that social dominance is a rare quality. only few has it!
- The most important part is the cut-off children. Two children had no linkes at al. It indicates an isolation and social difficulties (see chart below).
All data presented above drains to one network diagram:
Below is a report, and a network image from other reports, reflecting low social cohesion of a class, slashed into cliques, connected by "intermediaries" Children:
Report:
Network Image: (blue linkes - existing connections; red linkes - desired / missing connections)
Comments of kindergarten and school teachers, and school directors, after learning the report:
- "Wahoo, how did I not see it ...";
- "I want to use this system to track the progress of special-education students within the group";
- "I thought I might be wrong about the 'Queen Class', but not about the disconnected children" ...
- "I'd like - among other things - to use the system twice in every grade, when I need to embed the children in classes.
When should we use ONA?
- In order to identify and track cut-off children;
- To assess the effectiveness of treatment with any problems found;
- For periodically reviewing the integration of special-needs children and disadvantaged-populations in "normal" classes.
- When there is a problem, and we want to get to the bottom of it;
- Before entering into a new position (director, teachers, grade coordinator etc.);
- Before replacements of children in classes;
- In order to examine the effect of changes made.
- In order to examine relationships within the educational staff.
Additional benefits
- Monitoring tools for managers and teachers;
- Evaluation of children and classes;
- Identifying emerging trends in the school and classrooms;
- Identifying "agents of change in classes, and how effective we are in using them.
Summary
We can configure ONA as "Disruptive Innovation", because of the absolute advantage it has over the traditional diagnosis.
Network diagnostics - like all new domains - requires experience and skill acquisition. Now is the opportunity to gain it. Breakthroughs take time to sink in. For example, the medical use of Penicillin was started only ten years after its discovery; The internet and laser needed a long time to find their place; And so on. However at a certain point, those changes become viral.
When ONA becomes viral in the education field, the benefit will be in the hands of those who know and accumulated knowledge about using ONA effectively!
Bibliography
- Christensen Clayton M. (2003), The Innovator's Dilemma, NY: Harper Paperbacks.
- McBrien J.L., Brandt R.S. (1997), The Language of Learning: A Guide to Education Terms, Alexandria, VA: Association for Supervision and Curriculum Development.
- Sherman, L. W., Hall-Fitz, K. and Hofmann, R. (2002), Student satisfaction with teaming and looping in Middle-school adolescents, Paper presentation to the Mid-Western Educational Research Association. Columbus, OH.
- Tanz Jason (2003) A Brief History of Management, CNNMoney, October, downloaded on 25/11/12.
- Trickett E.J., Moos R H. (1995), Classroom Environment Scale Manual, 3rd Edition, Palo Alto, CA: Consulting Psychologists Press.
- van der Aalst Wil M.P., Song Minseok (2004), Mining Social Networks: Uncovering interaction. patterns in business processes.
- Wilkinson, R.B. and Kraljevic, M. (2004), "Adolescent Psychological Health and School Attitudes: The Impact of Attachment Relationships". In T. Bowles, (ed.) Proceedings of the Australian Psychological Society's Psychology of Relationships Interest Group, 4th Annual Conference, pages 150-155, Melbourne, Australia.


